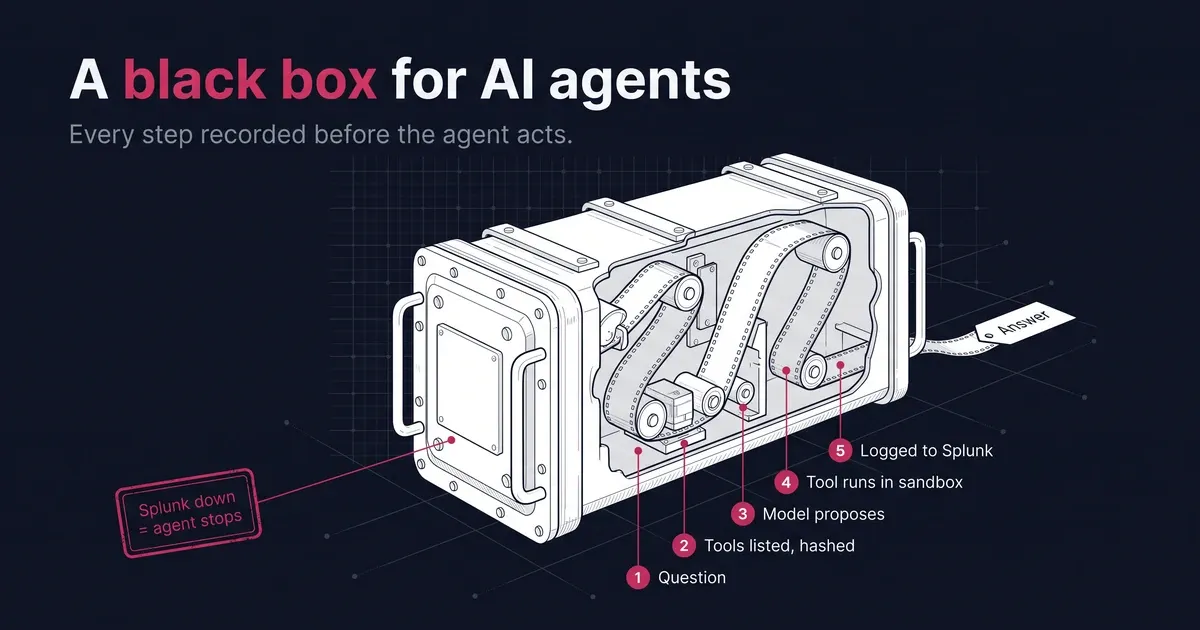
I built a small agent to watch this happen: three Python files, no agent framework, every step sent to Splunk before the next one runs. One question produced 25 events. This guide starts from zero, shows the code behind each part, then reads those 25 events one by one.
What are the parts of an AI agent?
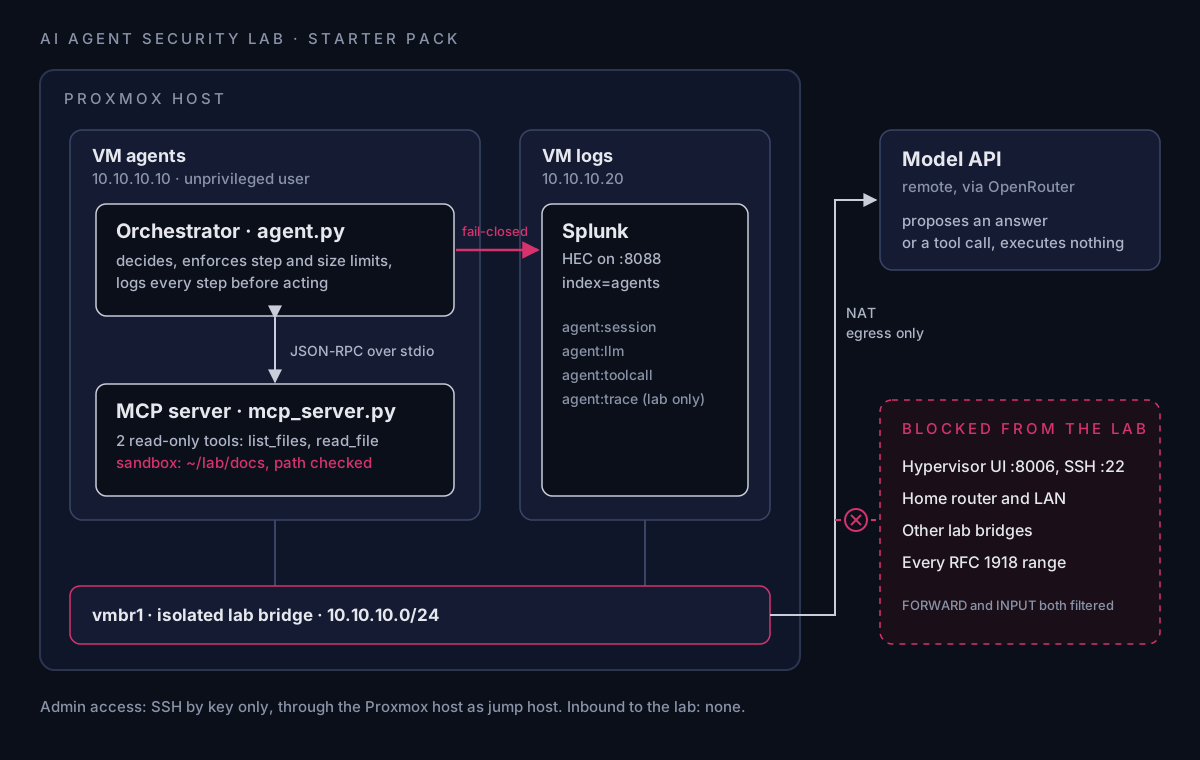
Four parts, three of them on your machine. The model sits behind an API.
| Part | File | What it does | What it never does |
|---|---|---|---|
| Model (LLM) | remote, through OpenRouter | Reads the context, reasons, returns text or a tool call as JSON | Runs code, reads files, opens connections |
| Agent loop | agent.py, 151 lines |
Builds the context, calls the model, runs the requested tools, stops at a final answer or after 6 turns | Runs a tool outside the MCP server |
| MCP server | mcp_server.py, 60 lines |
Holds the tools and their descriptions, executes them inside a sandbox | Talks to the model |
| Logger | hec_logger.py, 67 lines |
Sends every step to Splunk and stops the agent if Splunk does not acknowledge | Lets the model write into the logs |
The only part that reasons is the model. Everything that acts is ordinary code you can read, test and log.
How does the agent start the MCP server?
As a child process. The agent launches mcp_server.py with the same Python interpreter, then talks to it through the child’s standard input and output. No network port is opened.
server = StdioServerParameters(command=sys.executable,
                               args=[str(HERE / "mcp_server.py")],
                               env=dict(os.environ))
async with stdio_client(server) as (read, write):
    async with ClientSession(read, write) as mcp:
        init = await mcp.initialize()               # handshake
        tools = (await mcp.list_tools()).tools      # discovery
The code is asynchronous because the client reads the server’s replies while it keeps writing requests on the other stream. stdio_client starts the subprocess, and ClientSession speaks the protocol.
The protocol is JSON-RPC 2.0, one JSON object per line. The MCP specification calls this the stdio transport: newline-delimited messages over the standard streams of a subprocess the client launched. The first exchange is a handshake:
{"jsonrpc": "2.0", "id": 1, "method": "initialize",
 "params": {"protocolVersion": "2025-11-25", "capabilities": {...},
            "clientInfo": {...}}}
In my session, the server answered with its name, lab-files, protocol version 2025-11-25, and its capabilities: tools, prompts and resources, none of them able to change during the session (listChanged: false). Then the agent asked for the tool list with tools/list.
What is inside an MCP server?
A list of functions with a description each. In the MCP Python SDK, FastMCP turns a decorated Python function into a tool:
mcp = FastMCP("lab-files")

@mcp.tool()
def read_file(path: str) -> str:
    """Read one text file from the lab documents folder. Use a path returned by list_files."""
    target = _safe_path(path)          # resolve the path, refuse anything outside the sandbox
    raw = target.read_bytes()
    return raw[:20_000].decode("utf-8", errors="replace")
Three things happen in that decorator:
- The function name becomes the tool name:
read_file. - The docstring becomes the tool description, the text the model reads to decide when to use it.
- The type hints become the input schema: one required string,
path.
This is the entry the agent received for read_file in tools/list, copied from the trace:
{"name": "read_file",
 "description": "Read one text file from the lab documents folder. Use a path returned by list_files.",
 "inputSchema": {"type": "object", "title": "read_fileArguments",
                 "properties": {"path": {"title": "Path", "type": "string"}},
                 "required": ["path"]}}
Only decorated functions exist for the model. _safe_path sits in the same file, but no request can call it directly. This server exposes two tools, list_files and read_file, and nothing that writes, sends or deletes.
The description deserves a second look. It is plain text written by whoever wrote the server, and the model treats it as guidance. A server update can change what the model is told to do without a single change to agent.py, because the agent discovers tools at runtime. That is the entry point of tool poisoning, so the agent logs a SHA-256 of every description at the start of each session.
How does the model decide to call a tool?
The agent converts the MCP tools into the format the model API expects, then sends them with every request:
openai_tools = [{"type": "function",
                 "function": {"name": t.name,
                              "description": t.description,
                              "parameters": t.inputSchema}}
                for t in tools]

resp = llm.chat.completions.create(model=MODEL, messages=messages, tools=openai_tools)
The model does not run read_file. It returns a message that asks for it, with the arguments serialized as a JSON string, in the format OpenRouter documents for tool calling. This is the model’s reply at turn 2 of my session, from the trace:
{"content": null,
 "tool_calls": [
   {"id": "call_LvjcsHyxoSJyHkZQioVFmaHd", "name": "read_file",
    "arguments": "{\"path\":\"incident-report-2026-09.md\"}"},
   {"id": "call_SguvWH6kAl0H6UeetDgmoVLG", "name": "read_file",
    "arguments": "{\"path\":\"access-policy.md\"}"}],
 "finish_reason": "tool_calls"}
No text, two requests, and a finish reason of tool_calls. The reasoning happens inside the model, and what comes out is a request. Whether the request runs is the loop’s decision.
What does the agent loop look like in code?
A for loop with a turn limit. Here it is without the logging lines:
messages = [{"role": "system", "content": SYSTEM_PROMPT},
            {"role": "user", "content": question}]

for step in range(1, MAX_STEPS + 1):                       # MAX_STEPS = 6
    resp = llm.chat.completions.create(model=MODEL, messages=messages, tools=openai_tools)
    msg = resp.choices[0].message
    if not msg.tool_calls:                                  # no tool requested
        answer = msg.content                                # final answer
        break
    messages.append({"role": "assistant", "content": msg.content or "",
                     "tool_calls": [...]})                  # keep the request in the history
    for call in msg.tool_calls:
        args = json.loads(call.function.arguments or "{}")
        result = await mcp.call_tool(call.function.name, args)   # JSON-RPC tools/call
        text = "\n".join(c.text for c in result.content)
        messages.append({"role": "tool", "tool_call_id": call.id, "content": text})
Every line maps to a decision you can secure:
| Line | Decision | Control in the lab |
|---|---|---|
range(1, MAX_STEPS + 1) |
How long the agent may run | 6 turns, then max_steps_reached |
chat.completions.create(...) |
What the model sees | Full context logged in trace mode |
if not msg.tool_calls |
When the agent stops | Final answer logged before it is returned |
mcp.call_tool(...) |
What actually runs | Only the server’s two read-only tools exist |
messages.append({"role": "tool", ...}) |
What goes back into the context | Logged before it reaches the model |
Why does the context grow at every turn?
Because the model keeps no memory between calls. Each request carries the full history, so the loop appends the model’s request and every tool result before asking again.
| Turn | Messages sent | Prompt tokens | What was added |
|---|---|---|---|
| 1 | 2 | 136 | System prompt and question |
| 2 | 4 | 173 | The model’s call to list_files and its result |
| 3 | 7 | 446 | The model’s two calls to read_file and the two documents |
The prompt more than tripled between turn 1 and turn 3, and most of the jump comes from the 985 bytes of the two documents. A long tool result is paid for again at every following turn, one reason the server caps each read at 20,000 bytes. A document read at turn 2 also stays in the context for the rest of the session, so any instruction hidden inside it keeps reaching the model.
How is every step logged before the agent acts?
Through one method that refuses to fail silently:
def send(self, sourcetype: str, event: dict) -> None:
    payload = {"time": time.time(), "sourcetype": sourcetype, "index": self.index, "event": event}
    try:
        r = self.http.post(self.url, json=payload, timeout=5, verify=self.verify)
    except requests.RequestException as exc:
        raise LoggingError(f"Splunk HEC unreachable: {exc}") from exc
    if r.status_code != 200 or r.json().get("code") != 0:
        raise LoggingError(f"Splunk HEC rejected the event: {r.status_code} {r.text[:200]}")
The agent and the MCP server each have their own logger and share one session_id. If Splunk does not acknowledge an event within 5 seconds, LoggingError propagates and the agent exits with Agent stopped: Splunk HEC unreachable. I tested it with Splunk down: the agent never reached its first model call.
Two event families go to the HTTP Event Collector:
| Family | Sourcetypes | Content | Use |
|---|---|---|---|
| Summary, always on | agent:session, agent:llm, agent:toolcall |
Model, tools requested, arguments, token counts, durations; question, answer and tool results stored as SHA-256 hashes | Production-style audit logging without copying sensitive content |
Trace, LAB_TRACE=full |
agent:trace |
One event per step in clear text: the exact context sent to the model, its reply, each sandbox decision | Lab only, to read and replay a session |
The summary field of each trace event is a fixed string written in the code. If the model wrote it, an injected prompt could make a malicious step look harmless in the SIEM.
What happens in one question, frame by frame?
This search rebuilds a session in order:
index=agents sourcetype=agent:trace session_id=<SESSION_ID>
| sort 0 _time
| table _time component kind step summary 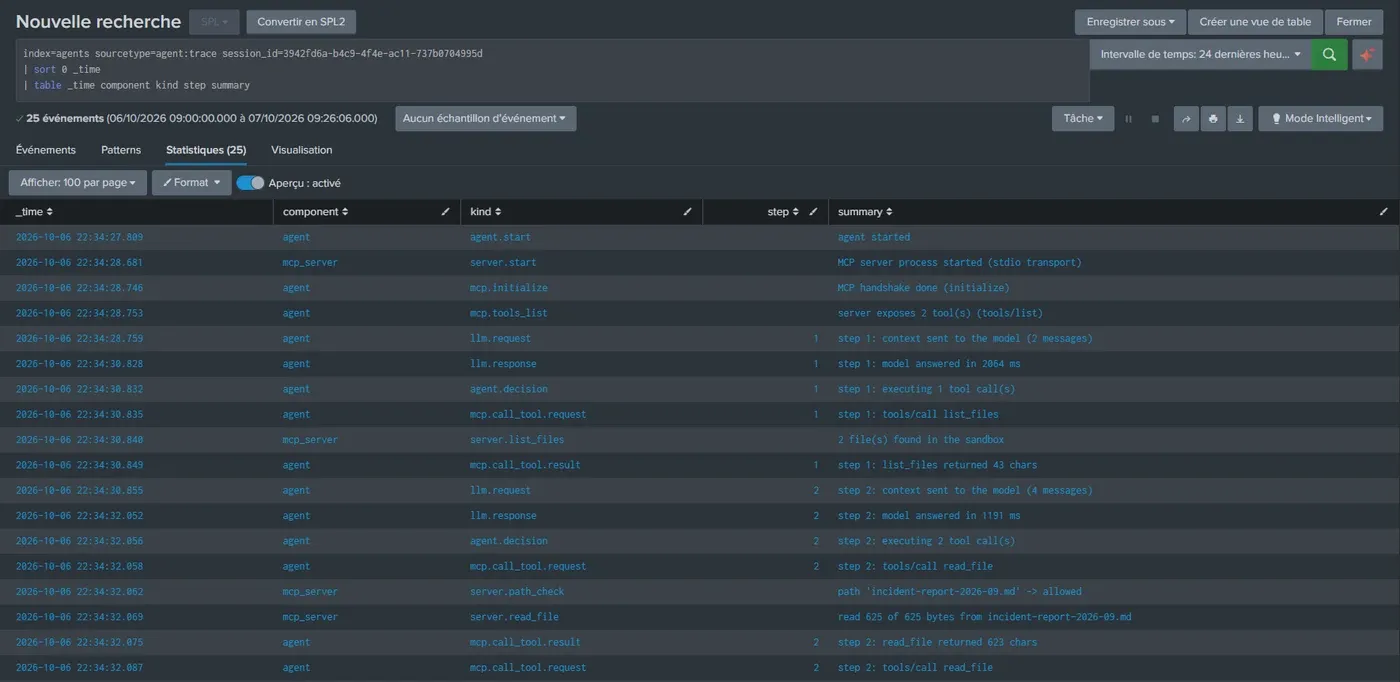
The question was “What was the root cause of the September incident?”, sent to openai/gpt-5.6-luna through OpenRouter. Here are the 25 trace events, timed from the first one. The 8 summary events of the same session (agent:session, agent:llm, agent:toolcall) are interleaved in the index and left out of this table.
| # | Time | Component | Event | What happens |
|---|---|---|---|---|
| 1 | 0.000 s | agent | agent.start |
The question, the model name, the system prompt and the turn limit are recorded |
| 2 | 0.872 s | mcp_server | server.start |
The child process is up and logs its sandbox folder |
| 3 | 0.937 s | agent | mcp.initialize |
Handshake done: protocol version and server capabilities |
| 4 | 0.944 s | agent | mcp.tools_list |
2 tools discovered, each description hashed |
| 5 | 0.950 s | agent | llm.request |
Turn 1: 2 messages and 2 tool definitions sent to the model |
| 6 | 3.019 s | agent | llm.response |
The model answers in 2,064 ms with one tool call, after 13 reasoning tokens |
| 7 | 3.023 s | agent | agent.decision |
The loop decides to run 1 tool call |
| 8 | 3.026 s | agent | mcp.call_tool.request |
tools/call list_files |
| 9 | 3.031 s | mcp_server | server.list_files |
2 files found in the sandbox |
| 10 | 3.040 s | agent | mcp.call_tool.result |
43 characters back: the two file names |
| 11 | 3.046 s | agent | llm.request |
Turn 2: 4 messages sent |
| 12 | 4.243 s | agent | llm.response |
The model answers in 1,191 ms with two tool calls |
| 13 | 4.247 s | agent | agent.decision |
The loop decides to run 2 tool calls |
| 14 | 4.249 s | agent | mcp.call_tool.request |
tools/call read_file on incident-report-2026-09.md |
| 15 | 4.253 s | mcp_server | server.path_check |
Path resolved inside the sandbox: allowed |
| 16 | 4.260 s | mcp_server | server.read_file |
625 of 625 bytes read |
| 17 | 4.266 s | agent | mcp.call_tool.result |
623 characters back: one dash in the file takes three bytes in UTF-8 |
| 18 | 4.278 s | agent | mcp.call_tool.request |
Second tools/call read_file, on access-policy.md |
| 19 | 4.282 s | mcp_server | server.path_check |
Path resolved inside the sandbox: allowed |
| 20 | 4.286 s | mcp_server | server.read_file |
360 of 360 bytes read |
| 21 | 4.295 s | agent | mcp.call_tool.result |
360 characters back |
| 22 | 4.299 s | agent | llm.request |
Turn 3: 7 messages sent |
| 23 | 5.697 s | agent | llm.response |
The model answers in 1,395 ms with text and no tool call, finish reason stop |
| 24 | 5.703 s | agent | agent.decision |
No tool requested: the answer is final |
| 25 | 5.705 s | agent | agent.final |
Session completed after 3 turns |
The final answer, 217 characters: “The root cause was that the invoice assistant’s mail-sending tool had no recipient allow-list. A supplier email exploited this by including hidden instructions to forward invoices to a new external accounting address.” The incident report is fictional, written for the lab.
What the timings show:
- The model is most of the wait. Its three answers took 4,650 ms of the 5.7 seconds the session lasted.
- Starting the MCP server is the slowest local step: 872 ms, the time to launch a second Python interpreter. After that, each tool call made the round trip in 12 to 15 ms.
- The model asked for two files at once at turn 2, the access policy included, although the question was only about the incident. The loop ran both calls one after the other, each with its own sandbox check. What the agent reads is bounded by its tools, so the sandbox has to be as narrow as the task.
- The model never touched a file. Every read went through
tools/call,server.path_checkandserver.read_file, in that order, with a log line at each stage.
Which attacks does each frame expose?
Read the frames as an attacker would, and each one points to a way of pushing the agent off course, plus the event that would show it:
| Frame | What an attacker targets | Risk (OWASP Top 10 for LLM 2025) | Signal in the logs |
|---|---|---|---|
mcp.tools_list |
The tool descriptions, rewritten by a compromised or malicious server | Tool poisoning, LLM01 and LLM03 | description_sha256 differs from the baseline |
llm.request |
A document returned at an earlier turn that carries hidden instructions | Indirect prompt injection, LLM01 | A tool sequence that differs from the usual pattern |
mcp.call_tool.request |
The path argument: ../.env, /etc/passwd, a symlink |
Excessive agency, LLM06 | server.path_check with inside_sandbox=false |
llm.request count |
A loop that never reaches a final answer | Unbounded consumption, LLM10 | status=max_steps_reached |
| Summary events | Secrets copied into the SIEM | Sensitive information disclosure, LLM02 | Hashes instead of content |
I ran the path attacks against this server: ../.env, ../../../etc/passwd, /etc/passwd and a symlink planted in the sandbox. All four were refused. _safe_path resolves the path first and checks it second, which catches two cases a string check misses. In Python’s pathlib, joining a base with an absolute path returns the absolute path, and resolve() follows symlinks to where they point.
How is the lab isolated from the rest of the network?
The agent runs on its own VM, on a Proxmox bridge that reaches the internet through NAT and drops every private range. The first version of my rules had a gap that only showed up when I tested from inside the agent VM: the hypervisor’s web UI (8006) and SSH (22) answered.
Two causes:
- Traffic to the host itself goes through the
INPUTchain, so aFORWARDrule never sees it. - My
DROPrules only matched traffic leaving through the uplink (-o vmbr0), so traffic to another bridge passed.
The fixed rules, now in the bootstrap script:
post-up iptables -I FORWARD -s 10.10.10.0/24 -d 10.0.0.0/8 -j DROP
post-up iptables -I FORWARD -s 10.10.10.0/24 -d 172.16.0.0/12 -j DROP
post-up iptables -I FORWARD -s 10.10.10.0/24 -d 192.168.0.0/16 -j DROP
post-up iptables -I FORWARD -s 10.10.10.0/24 -d 10.10.10.0/24 -j ACCEPT
post-up iptables -I INPUT -i vmbr1 -j DROP
post-up iptables -I INPUT -i vmbr1 -m conntrack --ctstate ESTABLISHED,RELATED -j ACCEPT
-I inserts at the top of the chain, so the last line written is evaluated first: the intra-lab ACCEPT wins over the 10.0.0.0/8 DROP, and replies win over the INPUT DROP. Retested from inside the agent VM with ping and TCP connects, the model API and Splunk answer, and the hypervisor, the LAN and the other lab bridges do not. The Proxmox network documentation describes the masquerading setup this builds on.
How do you rebuild the lab yourself?
You need a Proxmox VE host with 9 GB of free RAM for the default sizing (4 GB for the agent VM, 5 GB for Splunk), an SSH key pair, an OpenRouter API key and the Splunk Enterprise .deb from your Splunk account. Then three steps:
- On the Proxmox host, as root:
SSH_PUBKEY_FILE=/root/lab_key.pub bash proxmox/bootstrap-lab.sh. It creates the isolated bridge, verifies the SHA-512 of the Debian 13 cloud image and starts both VMs with cloud-init. - On the logs VM:
sudo SPLUNK_DEB=/tmp/splunk.deb AGENT_IP=10.10.10.10 bash splunk/configure-splunk.sh. It installs Splunk, creates theagentsindex, enables HEC and prints the token. - On the agent VM: copy
agent/env.exampleto~/lab/.env, fill in the keys, runbash agent/setup.sh, thenpython agent.py "your question", and paste the printedsession_idinto the search above.
The sample documents are fictional. Trace mode writes prompts and tool results to Splunk in clear text, so keep real data out of this lab. splunk/searches.md holds six starter searches, including the tool-description baseline.
What does this lab not cover yet?
One agent, two read-only tools, a local stdio MCP server. It does not yet test an agent with write or send permissions, a remote MCP server with authentication, agent identities in an enterprise directory, or a prompt injection hidden in a document the agent reads. Those are the next episodes of the CyberAI Security Journey, each added to the same repository with its controls and detections.
Sources
- Model Context Protocol, Transports and Tools (stdio transport,
tools/list,tools/call) - JSON-RPC Working Group, JSON-RPC 2.0 Specification (message format)
- Model Context Protocol, Python SDK (FastMCP,
stdio_client,ClientSession) - OpenRouter, Tool calling (request and
tool_callsresponse format) - OWASP GenAI Security Project, OWASP Top 10 for LLM Applications 2025 (risk mapping)
- Splunk documentation, Set up and use HTTP Event Collector in Splunk Web (log ingestion)
- Python documentation, pathlib (
resolve(), joining with an absolute path) - Proxmox VE wiki, Network Configuration (bridges and masquerading)
- Test results and trace: the author’s lab, 6 and 7 October 2026
Questions
How do AI agents work?
An AI agent is a loop around a language model. The loop sends the model the conversation and a list of tools. The model returns an answer or a JSON request to call a tool; the loop runs the tool, adds the result to the conversation and asks again, until the model gives a final answer or a turn limit is reached.
How does MCP work under the hood?
The Model Context Protocol is JSON-RPC 2.0 between an AI application and a tool server. With the stdio transport, the application starts the server as a child process and exchanges one JSON object per line over its standard input and output: `initialize`, then `tools/list` to discover the tools, then `tools/call` to run one.
Do AI agents remember previous steps?
The model does not. The loop keeps the history and resends all of it at every turn, which is why the context grew from 2 to 4 to 7 messages in the session above, and why token costs grow with every tool call.
Does the LLM execute the tools itself?
No. The model returns the tool name and its arguments as JSON. The agent's code decides whether to run it and sends the call to the MCP server, which executes the function. Every security control in this lab sits in that code, not in the model.
Can you build an AI agent from scratch in Python without a framework?
Yes. This one uses the MCP Python SDK for the tool server, an OpenAI-compatible client for the model, and a `for` loop. The whole agent is 278 lines across three files, logging included.
Is it safe to put real company documents in the lab?
Not with trace mode on. `LAB_TRACE=full` stores the full context and tool results in clear text in Splunk. Use the fictional sample documents, or turn tracing off and keep only the hashed summary events.